Market Update: We break down the business implications, market impact, and expert insights related to Market Update: TD Economics – Canadian Quarterly Economic Forecast – Full Analysis.
It is one battle after another for forecasters in 2026. Less than a month ago, changes in U.S. tariffs were the primary source of uncertainty (see commentary). Now a new war in the Middle East has added a far more consequential source of risk to the outlook. Energy prices have whipsawed day-to-day, but are well above pre-war levels, reflecting reduced supply through the Strait of Hormuz. Roughly 20% of the world’s oil passes through the Strait, including about half of Asia’s oil imports and a quarter of its LNG imports.
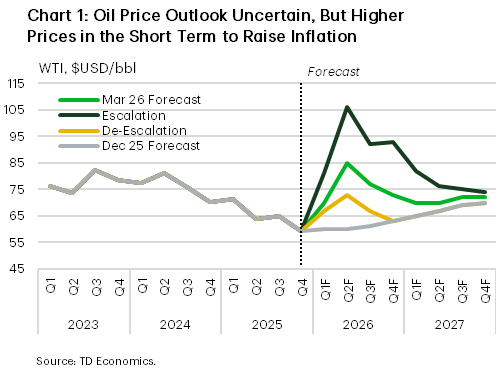
Beyond the terrible human toll, the duration of the conflict will determine how severely global energy markets are disrupted and how large the economic fallout becomes. This forecast assumes very limited transit through the Strait, which remains effectively closed for the next couple of weeks. This would keep oil prices elevated through the remainder of the month. Assuming oil and LNG shipments slowly resume in April, the average price of WTI is expected to moderate to $85 per barrel in Q2. We expect shipment activity to normalize by June, but oil prices remain elevated through mid-2026, reflecting tighter markets (as some supply remains offline) and a higher risk premium (Chart 1).
In the event that the crisis escalates and oil supply is further reduced or takes longer to come back online, oil prices could easily average more than $100 per barrel in the second quarter, staying above $90 per barrel through the end of the year as supply is more gradually restored (Chart 1). For North America, the impact on economic growth is manageable given its status as both a producer and consumer of energy. For countries more exposed, further escalation could tip the scales into recession.
Even if the jump in energy prices proves short-lived, it still leads to higher inflation in the near term, eroding purchasing power and slowing consumption. The disruption to energy markets poses a greater challenge for Europe and Asia than for North America. Low natural gas inventories leave Europe especially vulnerable if the conflict drags on, while several major Asian economies face heightened exposure to disruptions in oil and LNG shipments. Prior to the outbreak of the conflict, incoming data had pointed to potential upside in both regions. The eurozone was expected to gain further momentum on the back of expanded government spending, while China, supported by rising deficits, had announced a new target for solid growth this year. We still expect global growth in 2026 to come in slightly stronger than in our last update, largely reflecting resilience in the U.S. and parts of Asia outside of China, though risks are now more clearly tilted to the downside.
U.S. Economy Facing Down the Headwinds
The U.S. economy is facing higher oil prices from a position of strength. Growth in the second half of last year was stronger than expected, sustained by large investments in AI and a resilient consumer, despite a government shutdown weighing on fourth-quarter activity. This momentum, alongside the normalization in government operations, pointed to a firmer start to 2026 – a year expected to benefit from tax cuts and lower interest rates.
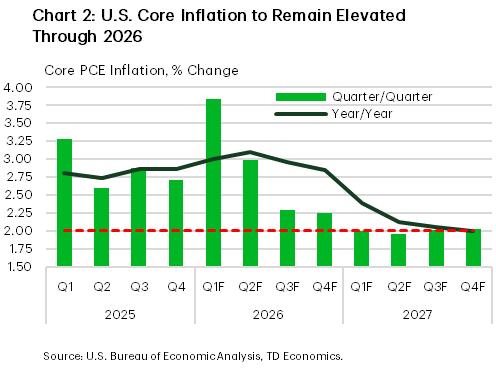
How quickly conditions can change. The conflict in the Middle East has sent shockwaves through global energy markets and reignited stagflation chatter. That conclusion is premature. At this point, the direct impact of higher oil prices shaves only a few tenths from economic growth in 2026 and adds about 0.8 percentage points to headline CPI, with a peak of 3.8% in the second quarter, while secondary effects contribute roughly a quarter of that to core inflation. This still leaves the economy expanding by a healthy 2.4% in 2026. In the escalation scenario, inflation could get as high as 4.5%, while growth would be trimmed by at least another two-tenths, and possibly more if a prolonged oil shock triggers much tighter financial conditions.
Still, the energy shock has been particularly ill-timed for businesses that are already adjusting to higher costs from tariffs. After the Supreme Court struck down President Trump’s IEEPA tariffs, the administration quickly imposed a 10%—soon to be 15%—global tariff under Section 122. Assuming the higher rate is implemented, the effective tariff rate would fall from roughly 16% to 13%. Even so, uncertainty persists around the longer-run tariff regime. The Section 122 tariffs expire after 150 days without congressional approval, which appears unlikely. The administration is therefore expected to rely more heavily on Section 301 (unfair trade practices) or Section 232 (sector-specific national security) tariffs to replace them. All told, a modestly lower effective tariff rate, combined with continued uncertainty about the final tariff regime, is unlikely to materially improve the outlook.
Through the volatility, the fundamentals supporting growth this year remain intact. Despite swings in financial markets, underlying financial conditions show no imminent signs of stress and remain accommodative by historical standards (see report). That’s good news for businesses pursuing their investment plans. At the same time, the roughly 60% increase in planned expenditures by hyperscalers, underscores that AI is likely to remain a significant driver of investment.
The outlook for the consumer is also constructive. Households are beginning to see the benefits of the One Big Beautiful Bill through higher take-home pay and larger tax refunds (see report). The main area to watch is the labor market. February’s employment report was weak but with some comfort that it came off a strong January print and was influenced by one-off factors, including a strike and weather-related disruptions (Chart 2). From that perspective, it is too soon to fundamentally change our view that the unemployment rate has peaked, though it ups the ante for the March report. A higher inflation forecast alongside rising labor-market risks present a challenging backdrop for the Federal Reserve. Core inflation is still running above the Fed’s 2% target, tariff-related price pressures are still filtering through, and now the energy shock provides less scope for further disinflation (Chart 2). As a result, the Fed is likely to remain cautious on rate cuts in the months ahead. There is still scope for a couple of additional cuts this year, but the timing is unlikely to be before September, absent a clearer cooling in inflation or more pronounced labor market softening.
Trade and Population Trends Shape Canada’s Outlook
In contrast, Canada’s economy sent mixed signals at the end of 2025, with output contracting even as the labour market tightened. The unemployment rate fell from a high of 7.1% in September to a low of 6.5% in January before backing up to 6.7% in February. Beneath the headline GDP decline, domestic demand remained resilient, expanding at a 2.4% quarter-on-quarter annualized pace. That came at the hands of solid consumer spending, government outlays on weapons systems, and business investment in machinery and equipment. The drop in overall output reflected a large drawdown in inventories, which is unlikely to be repeated in the near term.
Looking ahead, conditions are fraught given the recent spike in energy prices, ongoing negotiations over the future of CUSMA, and changes to immigration policy.
With oil prices up over 40% since the U.S. and Israel began bombing Iran, inflation is the primary concern. The impact on economic growth is expected to be modest, trimming roughly 0.1 percentage points in 2026. Higher oil prices boost activity in energy-producing regions, where the sector is a major driver of economic activity. With the broader energy sector accounting for about 10% of Canadian GDP (roughly twice the share in the United States), higher revenues help offset the impact of higher gasoline prices and tighter financial conditions on spending.
Headline CPI inflation is projected to peak at 2.8% year-on-year in the second quarter, before easing below 2.0% in 2027 as oil prices unwind. The impact on core inflation is more muted, as businesses’ ability to pass higher energy costs through to consumers is constrained by still-uneven domestic demand conditions. Core inflation is expected to continue trending toward 2.0% by year end, albeit at a slightly slower pace than anticipated in December. In the escalation scenario, headline inflation would likely pass the 3% mark and growth edge down another a tenth of a percentage point. Despite elevated uncertainty stemming from the Middle East conflict, we expect the Bank of Canada to look through this temporary supply shock and leave its policy rate unchanged in 2026.
Businesses will also be closely watching the progress of the CUSMA review. Private non-residential investment contracted by 0.3% last year as U.S. tariffs weighed on business confidence. The outlook for 2026 is not materially better, despite a capital investment intentions survey that suggests improvement. With the terms of Canada’s access to the U.S. market still unclear, we expect business investment to advance by a modest 0.6% this year. Outlays should gain momentum in the second half of the year, however, as clarity around the CUSMA review emerges.
Canada’s more restrictive immigration policy is also weighing on the economic outlook. The government’s new non-permanent resident targets should result in a small population decline in 2026, followed by subdued growth in 2027 and 2028. This is projected to leave the labour force about 0.2% smaller (Q4/Q4) by the end of 2026. With a shrinking pool of available workers, even slower job creation should be sufficient to keep the unemployment rate broadly stable this year, before it begins to edge lower in 2027.
Weaker population growth is dampening housing demand, particularly in the rental segment. Construction activity is reflecting two realities. Purpose-built rental activity is responding to government initiatives, but the owner-occupied space has run aground. The latter is expected to remain soft through much of the year amid weak resale activity, a necessary adjustment to align supply with market demand.
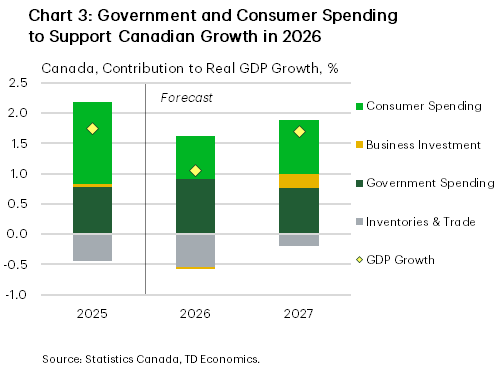
Canada’s economic outlook does not inspire enthusiasm, but it does represent an improvement over last year. Government expenditures across the country are expected to rise 3.5%, and despite persistent headwinds, consumer spending growth is expected to post a modest gain (Chart 3). Moreover, most Canadian exports continue to enter the U.S. tariff-free, allowing strong U.S. growth to lift exports 1.8% this year, following a 1.7% contraction in 2025. A clear resolution of trade uncertainty would further improve sentiment and could unlock stronger consumer spending and business investment than currently expected.