Market Update: We break down the business implications, market impact, and expert insights related to Market Update: 11 Pics On The Economy – Full Analysis.
Press Release – BNZ
Optimism around the global economy had been building. Consensus forecasts for global growth this year are up to trend-ish sorts of levels around 3%. A prolonged conflict would test this view.

- A new threat to the NZ recovery
- Too early to assess the magnitude of the impact
- But we revise up our inflation forecasts
- Renewed source of interest rate uncertainty; our view is unchanged
Chart 1: Another blow
The troubling escalation in the Middle Eastern conflict is a new source of uncertainty and risk for the global economy.
Energy price-driven inflation is one of the more immediate impacts. At the time of writing crude oil prices are below Monday’s US$120/barrel highs but still up more than 20% on February levels. A common LNG benchmark is up 50% on last month.
Optimism around the global economy had been building. Consensus forecasts for global growth this year are up to trend-ish sorts of levels around 3%. A prolonged conflict would test this view.

Chart 2: Petrol on the move
More so than crude oil, NZ petrol prices are closely linked to the price of refined fuel in Asia.
The price of refined oil has also pulled back from recent highs but, at current levels, continues to suggest upside risk on NZ retail petrol prices.
Extreme daily volatility in financial markets means it’s impossible to know where all this lands, including the impacts on downstream prices.

Chart 3: Broader disruptions
Along with the direct inflationary consequences of the conflict, there’s potential for broader disruptions to trade, supply chains, and activity.
There have been reports of changes to shipping and airfreight costs, transit routes and times, insurance, as well as increased port congestion.
Should supply chain pressures intensify, higher input costs for NZ businesses will result. The availability of some inputs may also be compromised. Neither is conducive to the lift in business investment we’ve been expecting to help drive the recovery.

Chart 4: Direct trade ties
The Middle East is a growing market for NZ exports. Goods exports to the region totalled $3.5b in the year to January, accounting for just over 4% of total merchandise exports. That is 40% ahead of just two years prior.
Services exports (largely tourism) and imports from the region are much smaller, the latter reflecting NZ’s shift away from importing crude from the Middle East to sourcing refined fuel from Asia.
Major exports are dairy and meat, major imports are fertilisers and plastics.
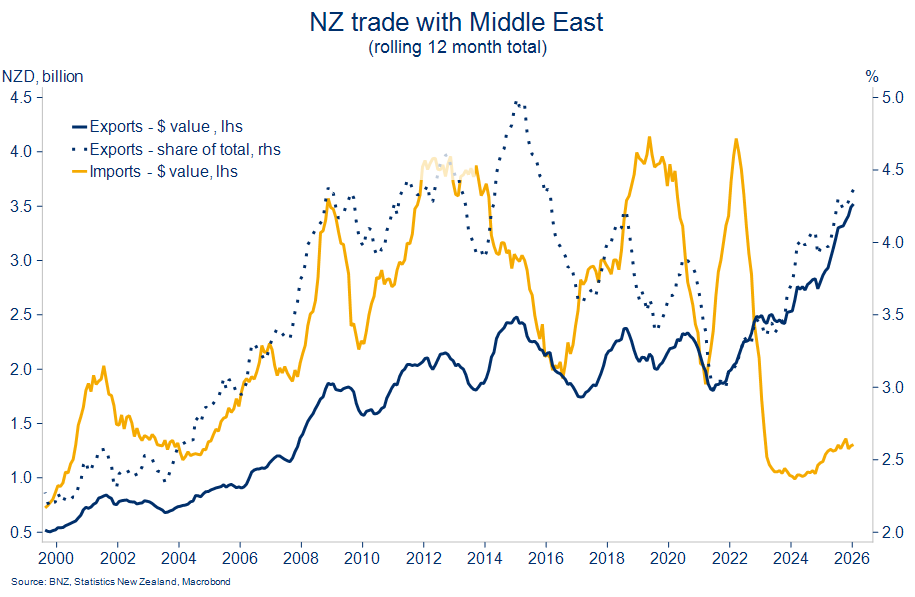
Chart 5: Supportive trade winds
The rising global commodity price tide has also been reflected in NZ’s export commodity prices. Supportive global demand has helped, along with tight supplies in some markets.
World prices for NZ’s commodity exports have swung back higher this year following 2025’s second half swoon.
They rose another 4.2%m/m in February according to the ANZ index, to be within spitting distance (or 2.6% to be precise) of last year’s high. Meat prices are 11% above the previous (2021) record high.

Chart 6: A knock to confidence?
With agri-cash inflows and lower interest rates at the helm, the NZ economy has been slowly navigating out of the doldrums.
The data pulse prior to the escalation in the Middle East portrayed an economic recovery broadening across sectors and, more gradually, the regions. Key high frequency indicators we watch remain mixed but with the balance tilting higher.
Business and consumer confidence indicators currently bookend the spread of data. Both will be watched closely from here as among the early ones to capture the fallout from offshore. March figures will be released near the end of the month.

Chart 7: Reluctant shoppers
The retail spending-orientated aspects of the data already paint a slightly confusing picture of the NZ consumer.
Spending on electronic cards is no higher now than four years ago. Consumer confidence is trending upwards but still miles below average. Meanwhile, according to Stats NZ’s Q4 numbers, retail sales volumes continue to hum at annual growth rates near 4½%.
The continued wedge between sentiment and spending is probably best explained by cost-of-living frustrations. Consumers are still spending, but they’re not happy about it. A spike in petrol prices will not help this dynamic.

Chart 8: Migration flows turning
Over 12 months’ worth of below-average net migration inflows are restraining areas of the economy like spending, housing, and construction. Urban areas naturally feel these impacts more acutely.
A tentative turning in the migration cycle thus promises to ease some of these pressures.
From a cycle low of just under 10k, annual net migrant arrivals increased to 14k in the year to December. Both additional arrivals and fewer departures contributed. A return to average levels closer to 30k p.a. is seen by early 2027.

Chart 9: Some better news?!
Bolstering hopes that population growth is on the turn is the fact the jobs market appears poised to do likewise.
And not just in an outright sense, but also relative to Australia. The ratio of NZ job ads relative to those in Australia has this year moved further above the recent lows. This ratio provides a decent six-month lead on relativities in antipodean unemployment rates.
The read across to people flows is less of a pull from the Aussie jobs market than there was.

Chart 10: Under (inflation) pressure
The fuel price implications of the oil price spike have compelled us to lift our inflation forecasts.
We see annual CPI inflation dipping from 3.1% to 2.8% in Q1, before heading back up to hug the top end of the RBNZ’s target range for the remainder of 2026. We stress that these forecasts are contingent on a set of assumptions that are changing intraday!
It’s a shift unlikely to panic the Reserve Bank. Standard practise is to ‘look through’ the direct impacts of a supply shock. But it’s directionally unhelpful, particularly given various measures of core and underlying inflation are already elevated.

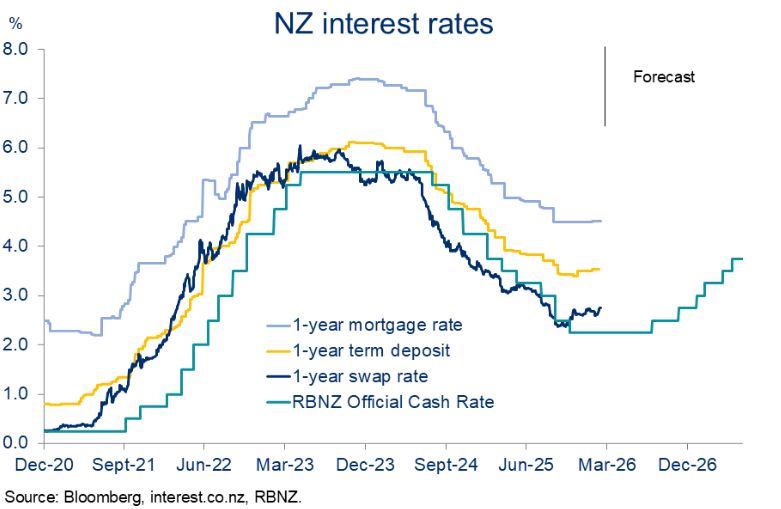
Chart 11: RBNZ to watch and wait
It’s not clear how the RBNZ will view the combination of heightened inflation risks set against a potentially reduced growth impulse.
In our view, the inflation consequences tilt the risk profile towards an earlier start to OCR tightening than the Bank’s latest forecast. We were there already with a September forecast start so haven’t moved. It’s still a long way off. The central bank may choose to watch and wait for now.
Global financial markets have clearly emphasised the inflationary consequences of the crisis more than the longer-term growth impost. Wholesale interest rates are volatile but much higher.
Content Sourced from scoop.co.nz
Original url